You probably already know about the importance of a diamond’s 4Cs (color, clarity, cut, carat weight) in defining diamond quality and ultimately determining its value. You may also know that a diamond grading report from an independent grading laboratory like GIA is your best way to be sure that your getting an unbiased assessment of your diamond’s quality. But in addition to the 4Cs, a diamond grading report also contains a wealth of information that tells a deeper story about your diamond.
Today, we’ll look at the plotting diagram that appears on GIA Diamond Grading reports and GIA Colored Diamond Grading reports to better understand how these reports deliver important clarity information that was captured during the grading process.
What is a Plotting Diagram?
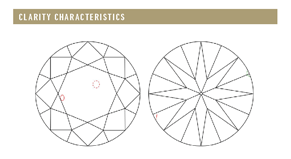
A plotting diagram is a map of a diamond’s clarity characteristics. These are the blemishes that reside on a diamond’s surface and the inclusions which are internal characteristics. The diagram is an important part of the GIA diamond grading report for D-to-Z color and colored diamonds. It documents the diamond’s present condition, supports the diamond’s clarity grade, and because no two diamonds will have the same diagram, it serves as a means of identification.
 What Does the Plotting Diagram Look Like?
The diagram itself will match or closely resemble the shape of your stone and its facet arrangement, which allows you to understand where each identifying feature is located on the diamond. Also, the plotting diagram will feature two views of your diamond: the crown view (from the top) and pavilion view (from the bottom). The crown and pavilion orientations will show how the face-up view corresponds to the face-down view.
What Characteristics are Plotted?
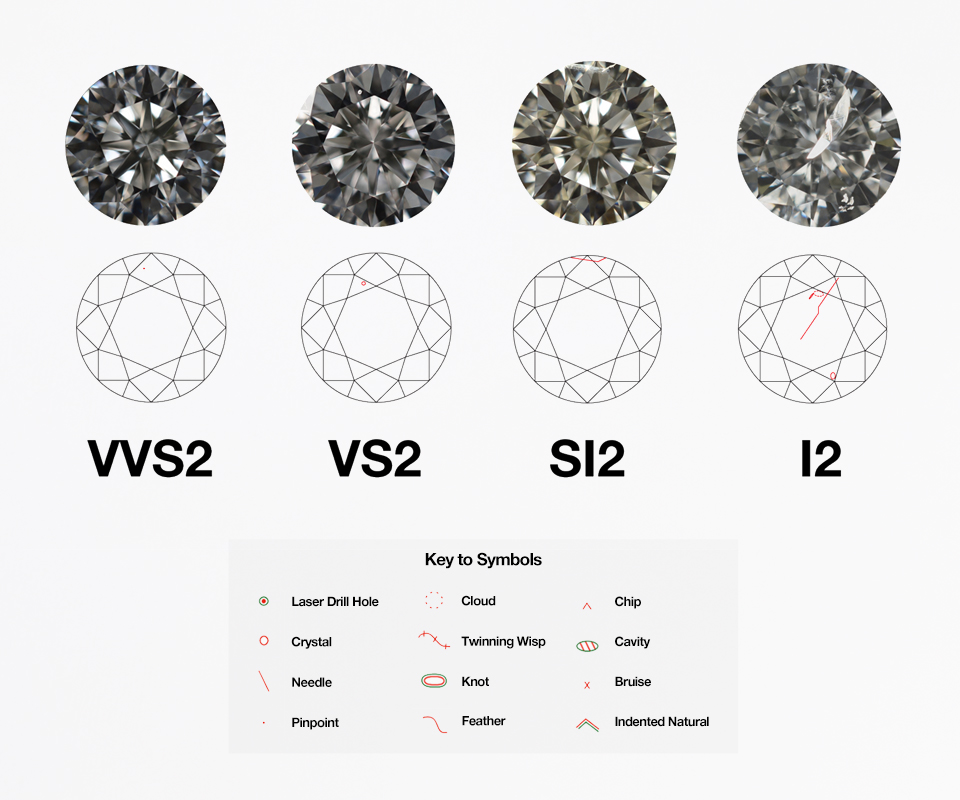
When plotting the diamond, each category of clarity characteristics is assigned a color. The colors and markings will help you identify each type of characteristic:
- Red: indicates most inclusions
- Red and green: when used together indicate cavities, indented naturals, knots, etch channels and laser drill-holes
- Green: indicates naturals
- Black: indicates extra facets
Here is a list of the characteristics that may appear on a plotting diagram, along with their corresponding symbols:
Some clarity characteristics are not plotted on the GIA reports if they are widespread or faint, or they are not needed to support the clarity grade or identify the diamond. However, they may be mentioned under Comments. Get to know Diamond Treatments and What They Mean to You, or look at Diamond Inclusions Defined for illustrated examples.
What Is the Plotting Procedure?
First your diamond is cleaned with a gem cloth and an appropriate facet diagram is selected that matches or most closely resembles the shape and cutting style of your diamond. Next, using a gemological microscope, graders use a systematic methodology to examine the diamond in order to find and identify its clarity characteristics. Graders draw clarity characteristics to scale in their approximate shape and location, as seen under 10× magnification.
The plotting details, along with the rest of data captured during the grading process, become part of the diamond’s permanent record and are stored in GIA’s global database for future reference.
For diamond reports without a plotting diagram, such as the GIA Diamond Dossier® and GIA Diamond eReport, GIA follows the same standards and criteria to determine the clarity grade. Up to four of the diamond’s significant clarity characteristics are listed to support the clarity grade. A laser inscription or digital image of the diamond is provided on the report to help identify it.
How Do I Read a Plotting Diagram?
As you look at the plotting diagram, you will see a “Key to Symbols” with the appropriate colors to demarcate the diamond’s characteristics. The characteristics will be listed in order of their importance to the clarity grade. If the diamond has a laser drill-hole, it will be listed first for disclosure purposes.
Listing Order for Characteristics:
- Laser drill-holes, if present
- Grade-setting inclusions
- Other inclusions
- Naturals
- Extra facets
With the help of this plotting diagram guide, you will be able to better understand the unique characteristics of your diamond’s clarity grade. If you have any other questions about the features and benefits of a GIA report, watch our How to Read a GIA Grading Report video.
Are you interested in submitting a diamond for grading? See How to Submit a Diamond For GIA Grading to get the information you need.


